From Spreadsheets to Live Stock Alerts: A Retail Transformation on Microsoft Fabric
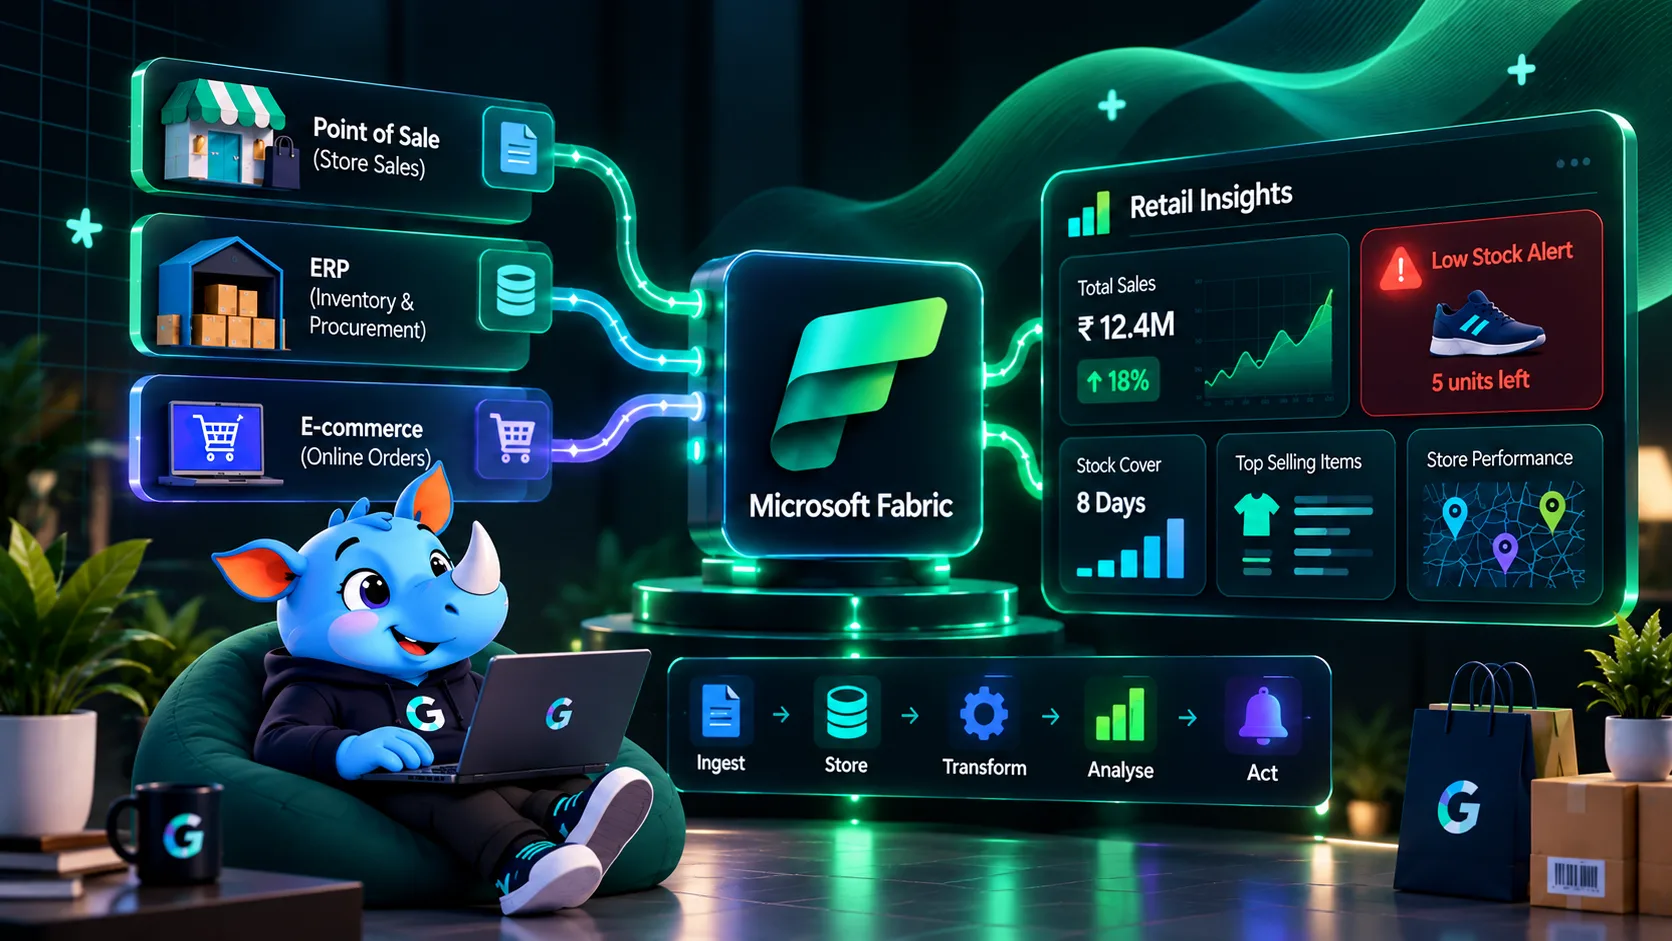
Most retailers know what sold yesterday. Far fewer know what is about to run out today. This article shows how a retailer with many stores used Microsoft Fabric to bring sales, inventory and online orders into one platform, with live dashboards and automatic alerts that protect revenue.
Key takeaways
- One platform replaces a chain of tools. Ingestion, storage, transformation, real time streaming and reporting all run inside Microsoft Fabric.
- One copy of the data. OneLake keeps a single governed copy, so stores, finance and e-commerce work from the same numbers.
- Real time where it matters. Stock levels and sales stream into Fabric, so shortages are flagged within minutes, not days.
- Fast reports without refresh headaches. Power BI reads straight from OneLake with Direct Lake mode.
The challenge: yesterday's numbers for today's decisions
A retailer with 40 stores and an online shop runs on three separate systems. The point of sale system records every transaction in each store. The ERP tracks purchasing and warehouse stock. The e-commerce platform holds online orders. Each team exports its own files, and a central analyst combines them in spreadsheets every morning.
The cost shows up in everyday decisions:
- Stockouts go unnoticed. A best seller runs out in several stores, and the problem is only spotted the next day.
- Overstock hides in plain sight. Slow items sit in the warehouse because nobody sees the whole picture across stores and online.
- Reports arrive late. Store managers see last week's performance on a Monday, too late to change the weekend.
- Numbers do not match. Finance, merchandising and e-commerce each quote slightly different sales totals.
- Pipelines are brittle. A changed column in one export breaks the entire morning report.
The solution: everything on one Fabric platform
Microsoft Fabric combines data integration, engineering, real time analytics and Power BI in one SaaS platform, with OneLake as the shared storage layer. For this retailer, that meant a single design instead of five tools stitched together.
| Need | Fabric component | What it does here |
|---|---|---|
| Bring in batch data | Data Factory pipelines | Loads ERP purchasing and stock data, and e-commerce orders, on a schedule |
| Stream live events | Eventstreams | Captures point of sale transactions and stock movements as they happen |
| Store everything once | OneLake with a Lakehouse | Keeps one governed copy of batch and streaming data as Delta tables |
| Clean and model | Notebooks (Spark) and Dataflow Gen2 | Standardises product codes, store names and dates, then builds business-ready tables |
| Analyse live data | Eventhouse (Real-Time Intelligence) | Answers fast queries on the latest sales and stock events |
| Act automatically | Activator | Sends an alert when stock or sales cross a threshold |
| Report | Power BI with Direct Lake | Dashboards that read directly from OneLake, with no scheduled import |
| Govern | Microsoft Purview integration and workspace security | Lineage, sensitivity labels and role-based access |
How the data flows
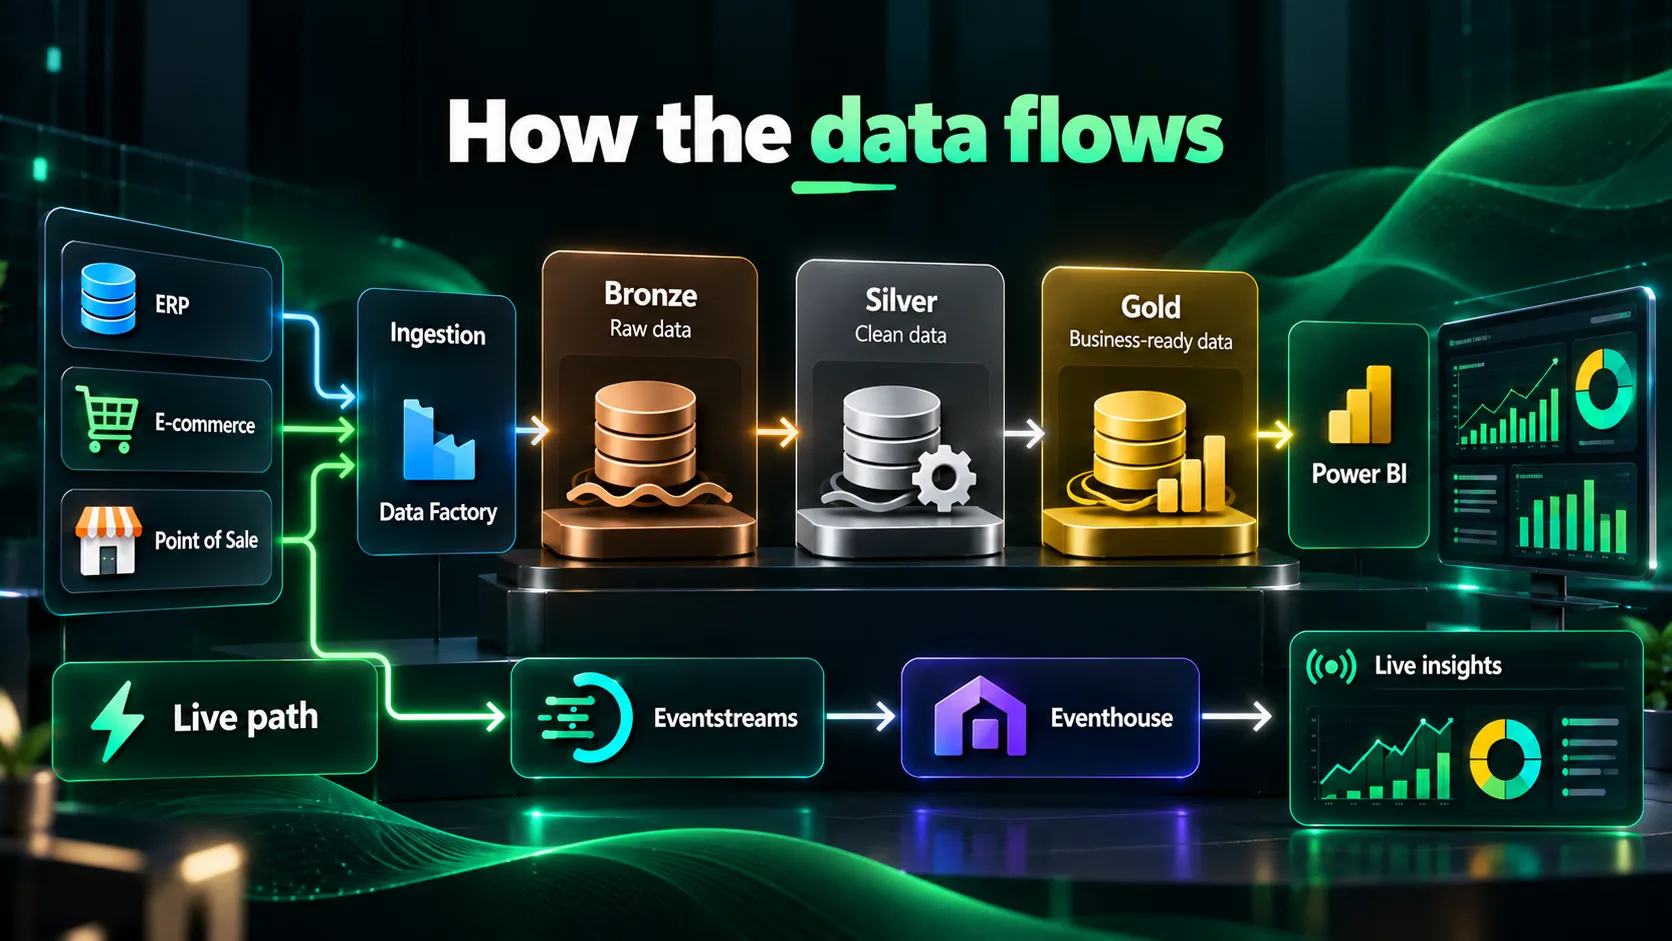
1. Bronze, raw data. Data Factory copies ERP and e-commerce data into the Lakehouse exactly as it arrives. Eventstreams capture each point of sale sale and stock movement in real time. Nothing is changed, so there is always a trail back to the source.
2. Silver, clean data. Spark notebooks remove duplicates, align product codes across systems, fix data types and standardise store and region names. Records that fail checks are set aside for review instead of being silently dropped.
3. Gold, business-ready data. Curated tables answer business questions directly, such as sales by store and hour, stock cover in days, and sell-through by product.
4. Live path. The same streaming events flow into an Eventhouse, where managers can see the last few minutes of sales and stock on a live dashboard.
What each team gets
| Team | Question answered | Update speed |
|---|---|---|
| Store managers | Which items are running low in my store right now? | Within minutes |
| Merchandising | Which products are selling through fastest, and where? | Hourly |
| Supply chain | Where should the next transfer or purchase order go? | Hourly |
| Finance | What are sales and margin for the day, week and month? | Daily, reconciled |
| E-commerce | How do online orders compare with demand in stores? | Hourly |
Governance built in
A shared platform only works if people trust it. Fabric handles this with the same tools used for everything else:
- Role-based access and row-level security let each regional manager see only their own stores, while head office sees everything.
- Sensitivity labels follow data from the Lakehouse through to the Power BI report.
- Lineage views show which source feeds each dashboard, so a disputed figure can be traced in minutes.
- A certified semantic model gives the business one approved definition of sales, margin and stock cover.
Lessons learned
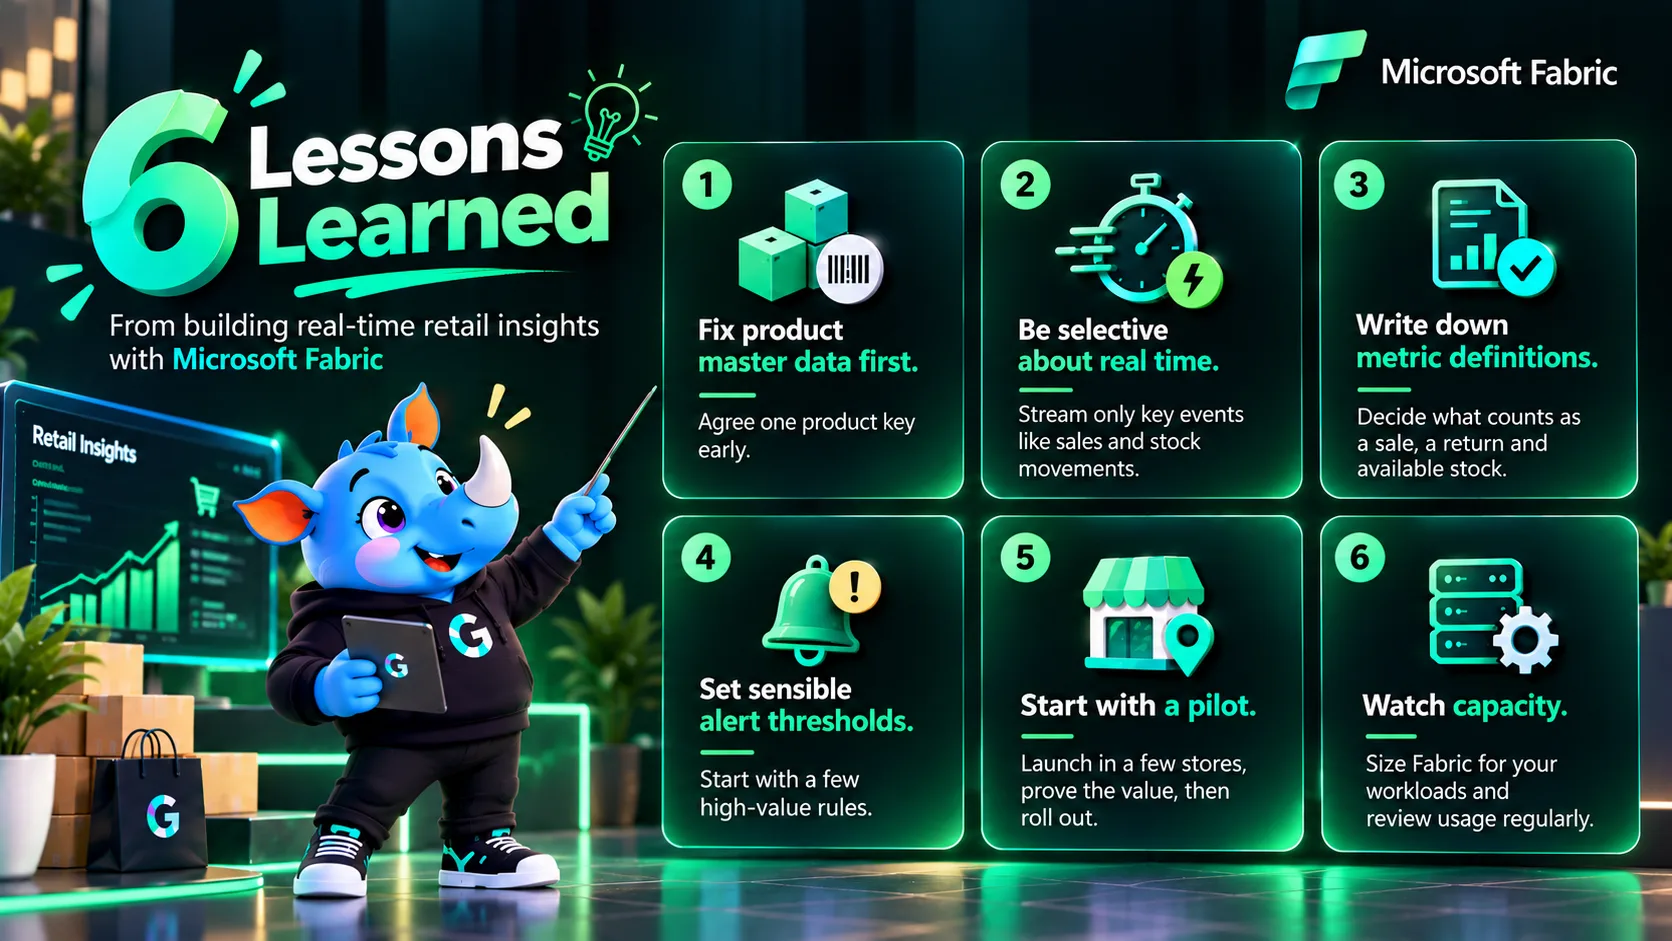
1. Fix product master data first. Mismatched product codes across the POS, ERP and online shop cause more problems than any technology. Agree one product key early.
2. Be selective about real time. Stream the events that drive action, such as sales and stock movements. Keep slower data, such as monthly budgets, in batch.
3. Write down metric definitions. Decide what counts as a sale, a return and available stock before building anything.
4. Set sensible alert thresholds. Too many alerts get ignored. Start with a few key rules, such as best sellers falling below two days of cover.
5. Start with a pilot. Launch in a handful of stores, prove the value, then roll out to the rest.
6. Watch capacity. Fabric runs on shared capacity, so size it for streaming and reporting workloads and review usage regularly.
The business impact
Retailers that build this kind of foundation typically see gains in four areas:
- Fewer lost sales: stockouts on fast movers are flagged and fixed sooner.
- Leaner inventory: one view across stores, warehouse and online helps reduce overstock and rebalance stock.
- Faster decisions: store and head office teams act on today's picture instead of last week's report.
- Less manual work and one set of numbers: analysts stop assembling exports, and every team quotes the same totals.
Final thoughts
The value of Microsoft Fabric is not any single feature. It is that ingestion, streaming, storage, modelling, alerts and reporting stop being separate projects and become one connected workflow. For a retailer, that shift turns data from a morning chore into a daily advantage on the shop floor.
Frequently asked questions
Learn more about modern data platforms
Whether you are planning a first pilot or reviewing an existing setup, a clear view of your current data is the best place to start. Genufy TechWorks helps teams design and deliver modern data engineering and analytics platforms, and can assess whether Microsoft Fabric is the right fit for your business.